![]()
The stellar winds of massive stars
Massive stars have a mass of about 10 to 100 times that of our Sun. They are also larger, with a radius of about to 20 times the solar radius. And they are also hotter, with surface temperatures of 15,000 to 50,000 K (compared to the approximately 5,750 K of the Sun). But most impressively is their luminosity, which can reach up to a million times that of the Sun. This extremely high luminosity has an interesting consequence: the light is so strong that it pushes away the outer layers of the star. In this way, a stellar wind is formed. The star is surrounded by this stellar-wind material which is steadily flowing away from the star, with speeds of up to 3000 km/s. The amount of material that is lost due to the stellar wind (the mass-loss rate) is substantial. During its relatively short lifetime of a few million years, a very massive star could easily lose half of its original mass.
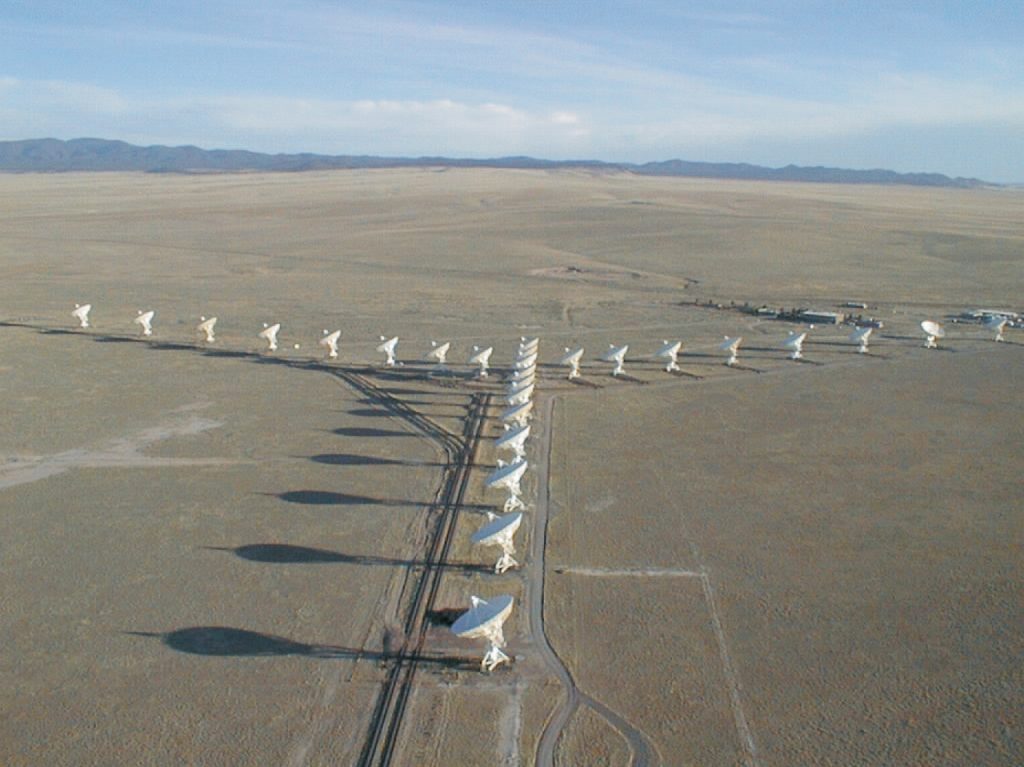 The radio telecopes of the Very Large Array (VLA) in New Mexico, USA. Image credit: NRAO/AUI/NSF.
The stellar-wind material around the star is detectable at various wavelengths. Ronny Blomme and colleagues from University College London used radio observations to determine the mass-loss rate of these massive stars. One of the radio telescopes they used to observe these stars is the Very Large Array (VLA). This is not a single telescope, but a set of 27 antennas that are used together to make an observation. There is a good reason why multiple antennas are needed in radio astronomy. A single radio telecope, even with a large dish, does not see very sharply, because of the long wavelength at which it observes. But by combining the information from different antennas, in a technique called interferometry, a much sharper image can be obtained.
.") The star ζ Puppis as seen by the ATCA radio telescope at a wavelength of 6 cm. The cross shows the optical position of the star. Figure adapted from R. Blomme et al. (2003, A&A 408, 715).
The star ζ Puppis as seen by the ATCA radio telescope at a wavelength of 6 cm. The cross shows the optical position of the star. Figure adapted from R. Blomme et al. (2003, A&A 408, 715).
Another telescope used is the Australia Telescope Compact Array (ATCA), which has a set of 6 antennas. With this telescope we observed the star ζ Puppis at radio wavelengths of 3.6 cm and 6 cm. One of the reasons we want to look at different wavelengths is that, in this way, we look at different regions of the stellar wind. The longer the wavelength, the further out in the stellar wind we are looking.
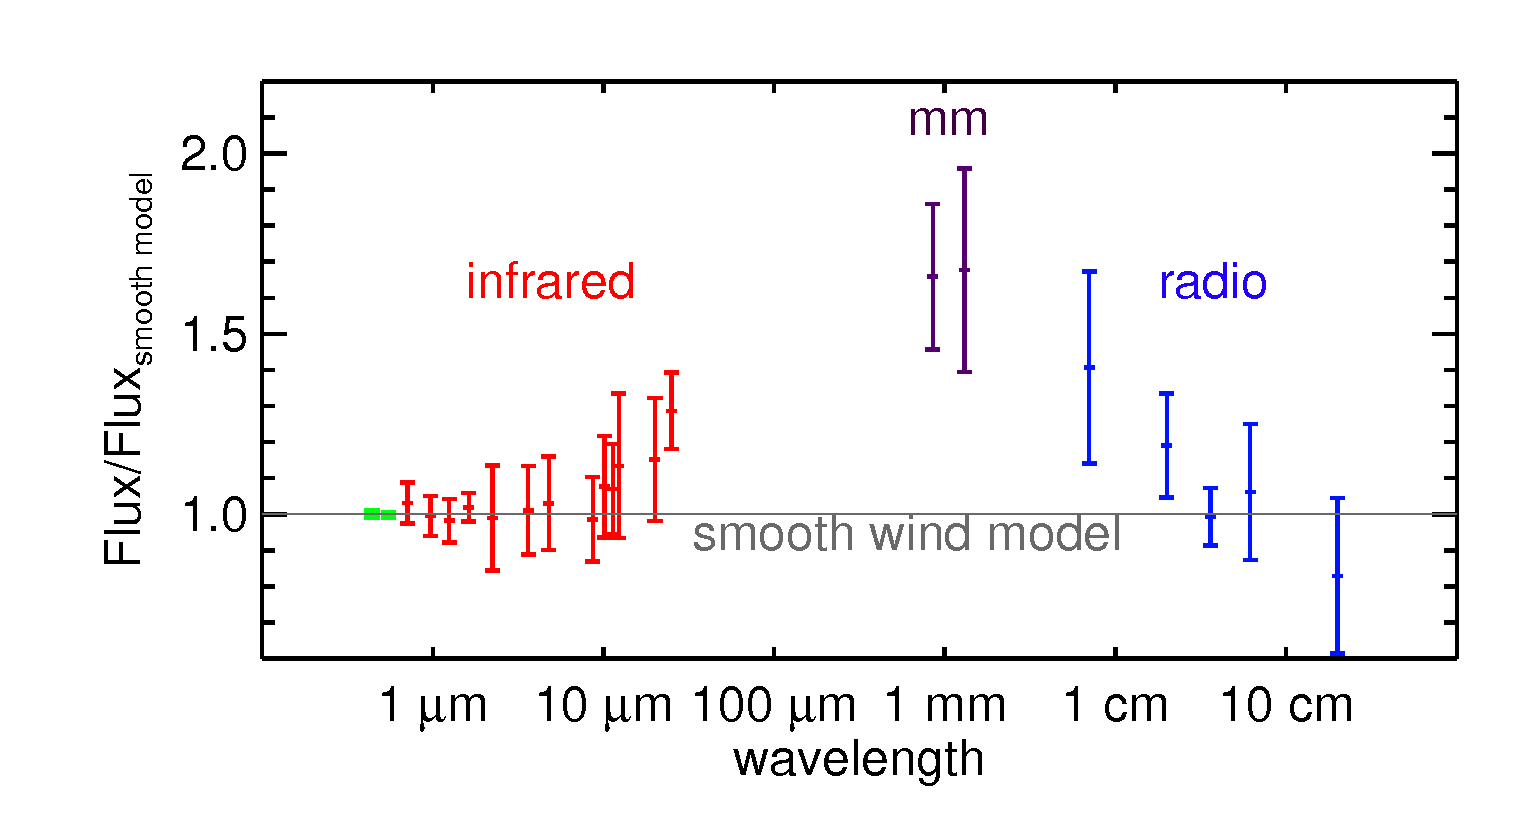 The fluxes of the star ε Orionis, as a function of wavelength, from the visual wavelengths (green colour) over the infrared ones (red), the millimetre ones (purple) to the radio wavelengths (blue). The fluxes are shown compared to what we would expect from a smooth wind. Figure adapted from R. Blomme et al. (2002, A&A 382, 921).
We can compare the fluxes at various radio wavelengths, and we extend that comparison to shorter wavelengths, such as millimetre and infrared. The flux at each of these wavelengths can be used to determine the mass-loss rate. And we of course expect the mass-loss rate to be the same, independent of the wavelength (this is shown by the "smooth wind model" on the figure). But this turns out not to be true. Especially at millimetre wavelengths, the flux is higher than expected. This excess flux can already be seen at the longest infrared wavelengths. In the radio, the excess flux is also present, and it decreases with wavelength.
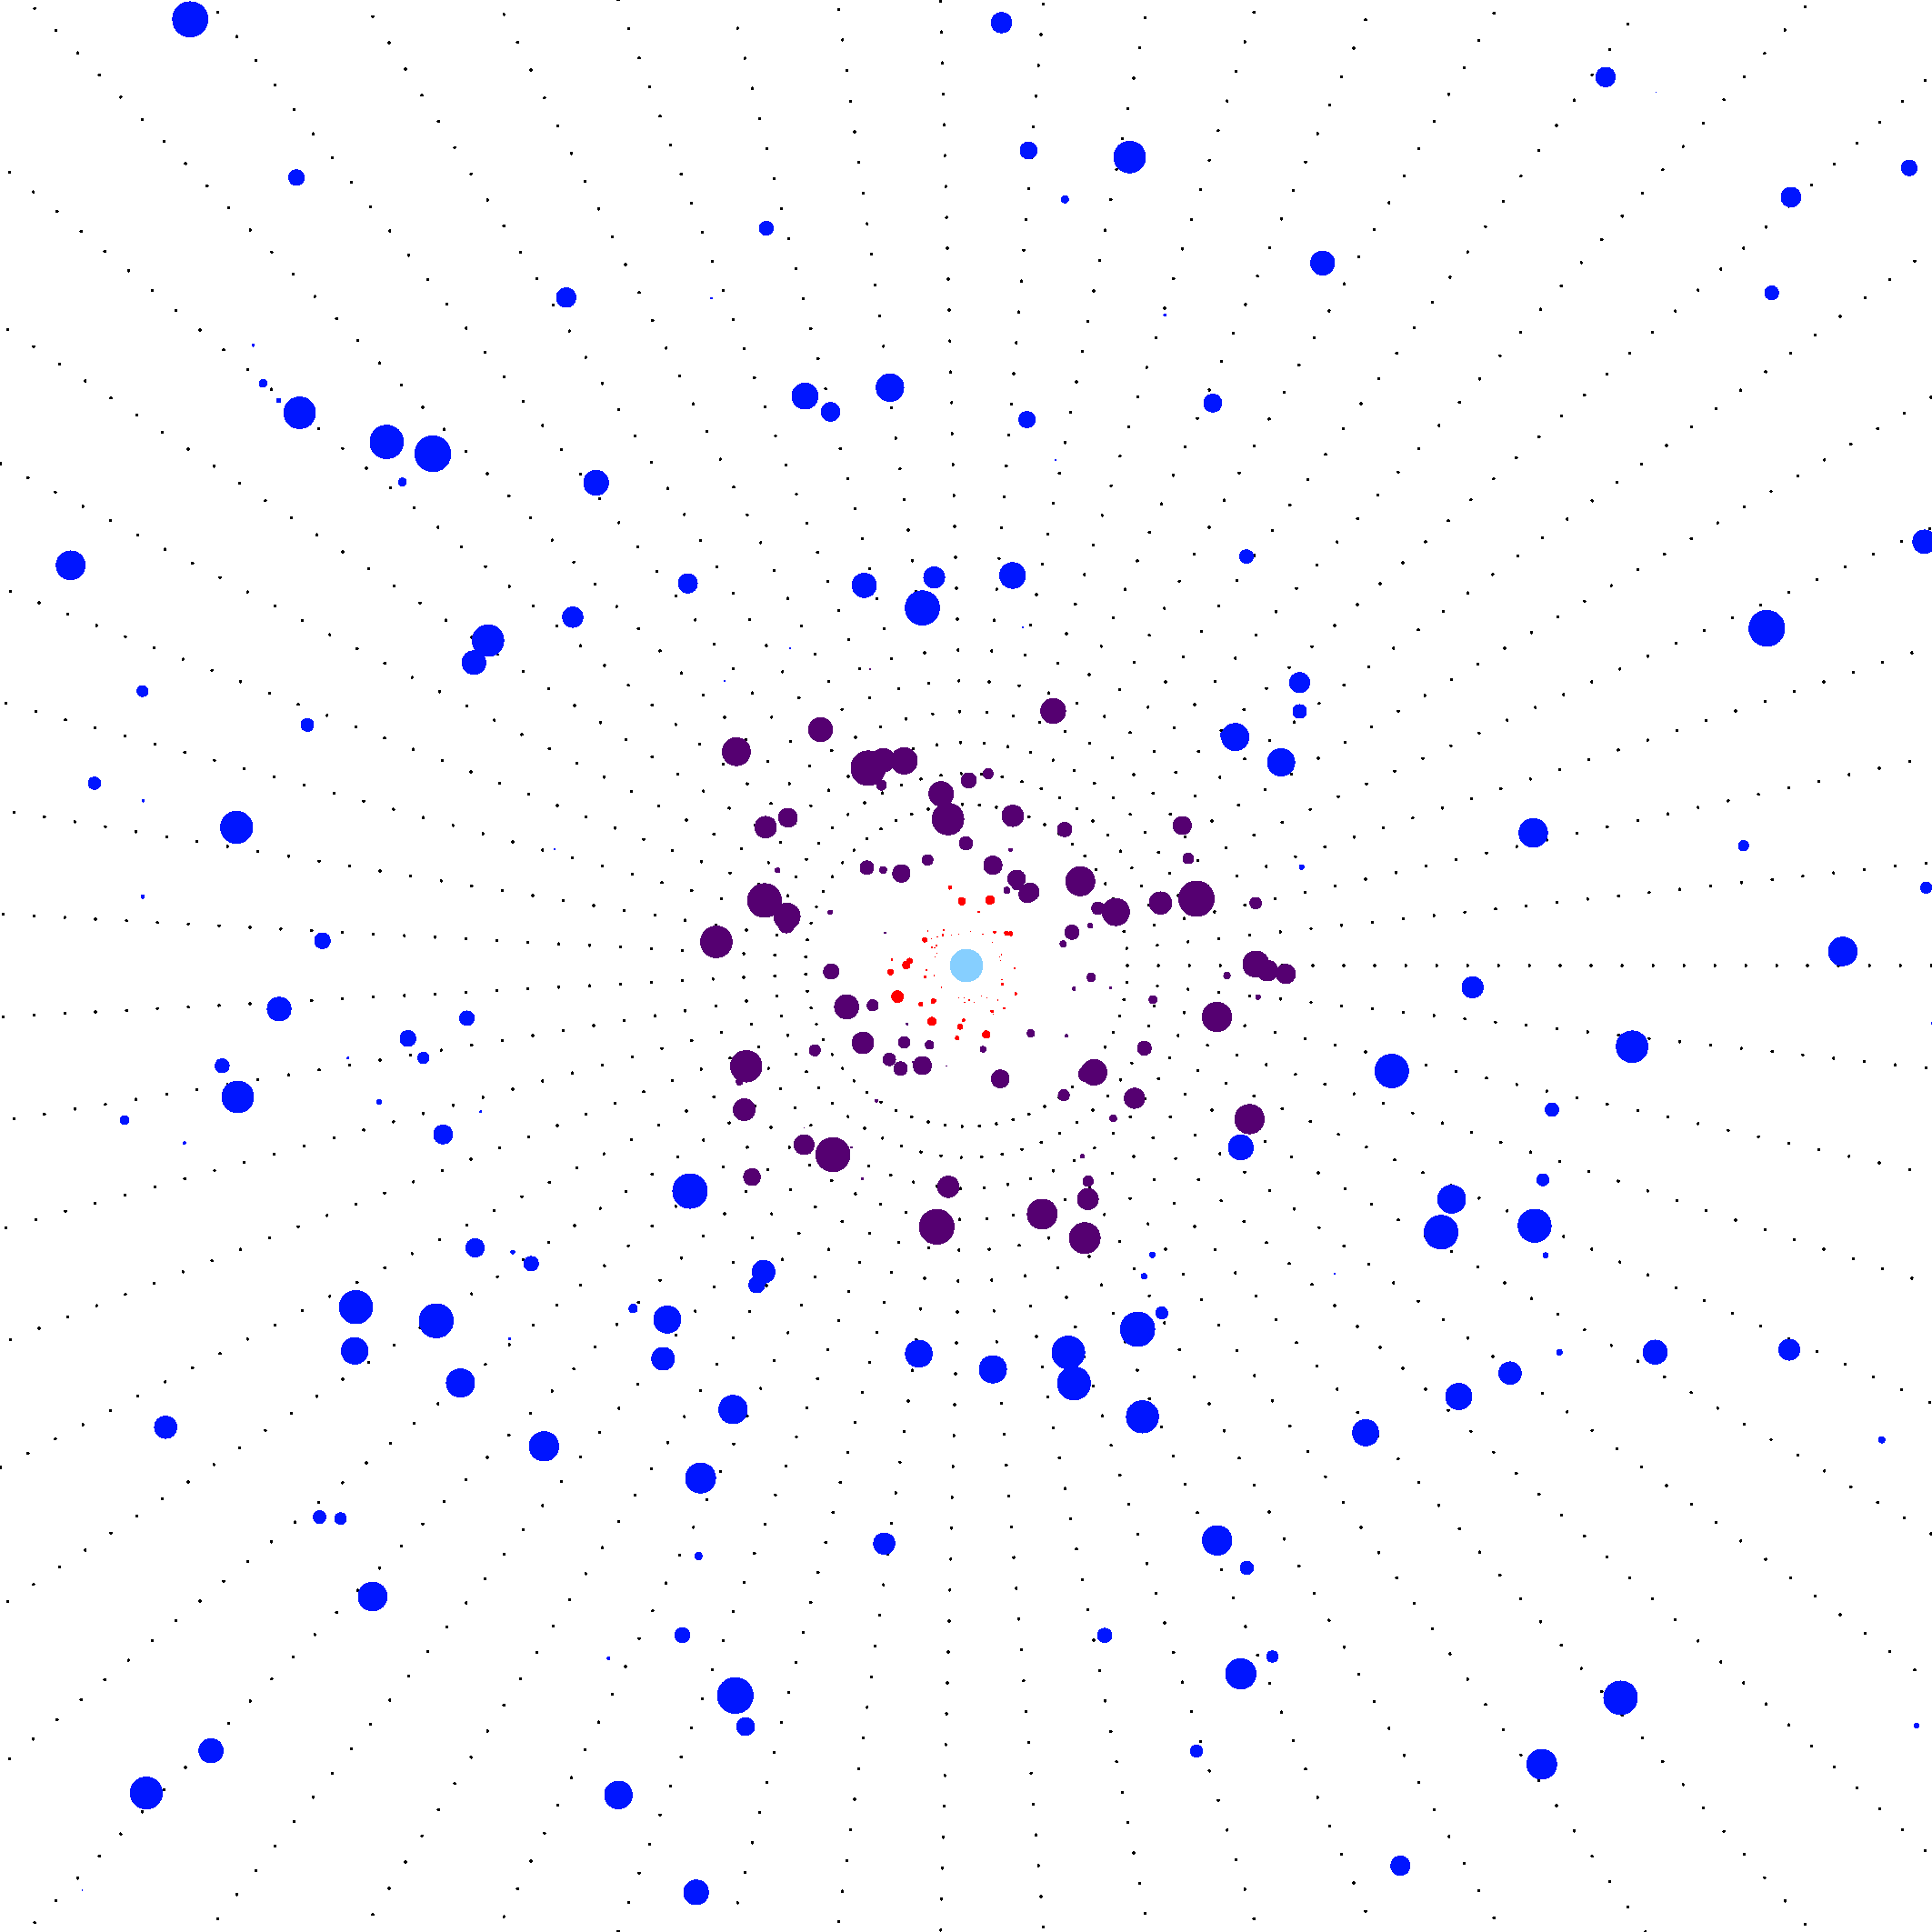 Clumps in the stellar wind. The light-blue disc at the centre of the figure is the star itself. Around it, the outflowing material is clumped. The colour-coding of the clumps corresponds to the wavelength at which we see their effect (red → infrared; purple → millimetre; blue → radio).
The reason for this excess flux is that the material in the wind is not smoothly distributed, but it is clumped. Because of the way the radio emission is generated, when the material is pushed together in a clump, it emits more flux. And there is even more. The excess flux at various wavelengths is not the same. This means that the amount of clumping is not the same in different regions of the wind. The ε Orionis figure shows that, close to the star, the clumping increases with distance from the star (corresponding to the infrared to millimetre wavelengths). Further out in the wind (corresponding to the radio wavelengths), however, the clumping decreases again.