![]()
3-D Radiative Transfer Modelling of the Winds of Massive Stars
We developed an advanced 3-dimensional non-LTE (non-local thermodynamic equilibrium) radiative transfer code Wind3D for detailed modeling of the physical conditions in the circumstellar environments and winds of stars with extended atmospheres. It solves the radiation transport problem in three geometric dimensions for arbitrary gas density structures and velocity fields.
The implementation of Wind3D is based on a finite element method that uses short characteristics in a 3-D Cartesian grid. Wind3D has been developed for high-performance computers with parallel processing. It is currently implemented as an (exact) accelerated lambda iteration scheme with a two-level atom formulation. Typical wind model calculations are performed with 71 x 71 x 71 grid points on an equidistant mesh. The code lambda-iterates the 3-D line source function to accuracies better than 1 percent. The local mean intensity integral currently sums 80 x 80 spatial angles for 100 wavelength points of the line profile. The non-LTE 3-D transfer equation is solved for 701 x 701 x 701 interpolated grid points using a Doppler profile function. Wind3D has carefully been load balanced for parallel processing and has excellent scaling properties for multi-threading. The code accepts arbitrary 3-D velocity fields without assumptions of axial symmetry. The numerical transfer scheme is efficient and very accurate to trace small variations of local velocity gradients on line opacity in strongly scattering dominated supersonic expanding stellar winds.
Below you can find 2 examples of performed studies:
Modelling Large Scale Wind Structures in Blue Supergiant J Puppis (HD64760)
Modelling the Asymmetric Wind Structure in Luminous Blue Variable Binary MWC 314 (V1429 Aql)
Modelling Large Scale Wind Structures in Blue Supergiant J Puppis (HD64760)
Discrete Absorption Components (DACs) observed in the broad P Cygni profiles of UV resonance lines are important tracers of the dynamics of line driven winds in massive hot stars. DACs are observed to propagate bluewards through the UV line profiles on time scales comparable to the stellar rotation period. Hydrodynamic models of Co-rotating Interaction Regions (CIRs) have been proposed to explain the observed DAC properties qualitatively. These large-scale wind structures are spiral-shaped density- and velocity-perturbations winding up in or above the plane of the equator that can extend from the stellar surface to possibly several tens of stellar radii. The CIRs can be produced by intensity irregularities at the stellar surface, such as dark and bright spots, magnetic loops and fields, or non-radial pulsations. The surface intensity variations alter the radiative wind acceleration locally, which creates streams of faster and slower wind material.
 fig1:
fig1:
Artist's impression of large spiral waves around massive hot B-type supergiant star J Puppis. Bright spots at the star's surface create delicate gas density enhancements winding up in the plane of the equator.
We model the detailed time-evolution of DACs observed in P Cygni profiles of the Si IV λ1400 resonance doublet lines of the fast-rotating supergiant J Puppis (B0.5 Ib). We adopt the common assumption that the DACs are caused by CIRs or large-scale structures of the stellar wind. We perform 3-D radiative transfer calculations with hydrodynamic models of the stellar wind that incorporate these large-scale density- and velocity-structures. The Wind3D code is used to investigate the physical properties of the CIRs with detailed fits to the DAC shape, evolution, and morphology.
 fig2:
fig2:
Hydrodynamic 3-D wind model with large-scale density and velocity structures computed with Zeus3D for J Pup required to best fit the DACs in Si IV λ1395. The bright spots at the equator are 20 % and 8 % brighter than the stellar surface, having opening angle diameters of 20 degrees and 30 degrees, respectively, and rotate 5 times slower than the stellar surface. The bright spots produce wind structures with density enhancements in CIRs compared to the surrounding smooth-wind density. The minimum density contrast is 0.87 (green colors), increasing to a maximum value of 1.32 (yellow and red colors). The maximum velocity difference in the CIRs compared to the smooth wind does not exceed ∼140 km/s. The bright spots cause spiraling density waves in the equatorial rotating wind.
For the hydrodynamic CIR models a local radiation force enhancement (or surface `spot') is introduced at the base of the stellar wind. The resulting equatorial density- and velocity-structures are inserted around the star with a thickness of 1 R* around the equatorial plane. Outside this region, the model density and velocity assume the smooth wind values. Figure 2 shows the density enhancements in the wind with respect to the smooth wind density due to two bright spots at the surface. The spots rotates counter-clockwise with a rotation period 5 times longer than the stellar surface rotation period (V_spot = V_rotation / 5). The wind streams almost radially through the CIR density structure. The wind flow decelerates due the relative increase of wind density in a region behind the CIR density contrast maximum. It causes a trailing velocity plateau (between the star and CIR) which strongly contributes to the DAC absorption at larger distances from the star.
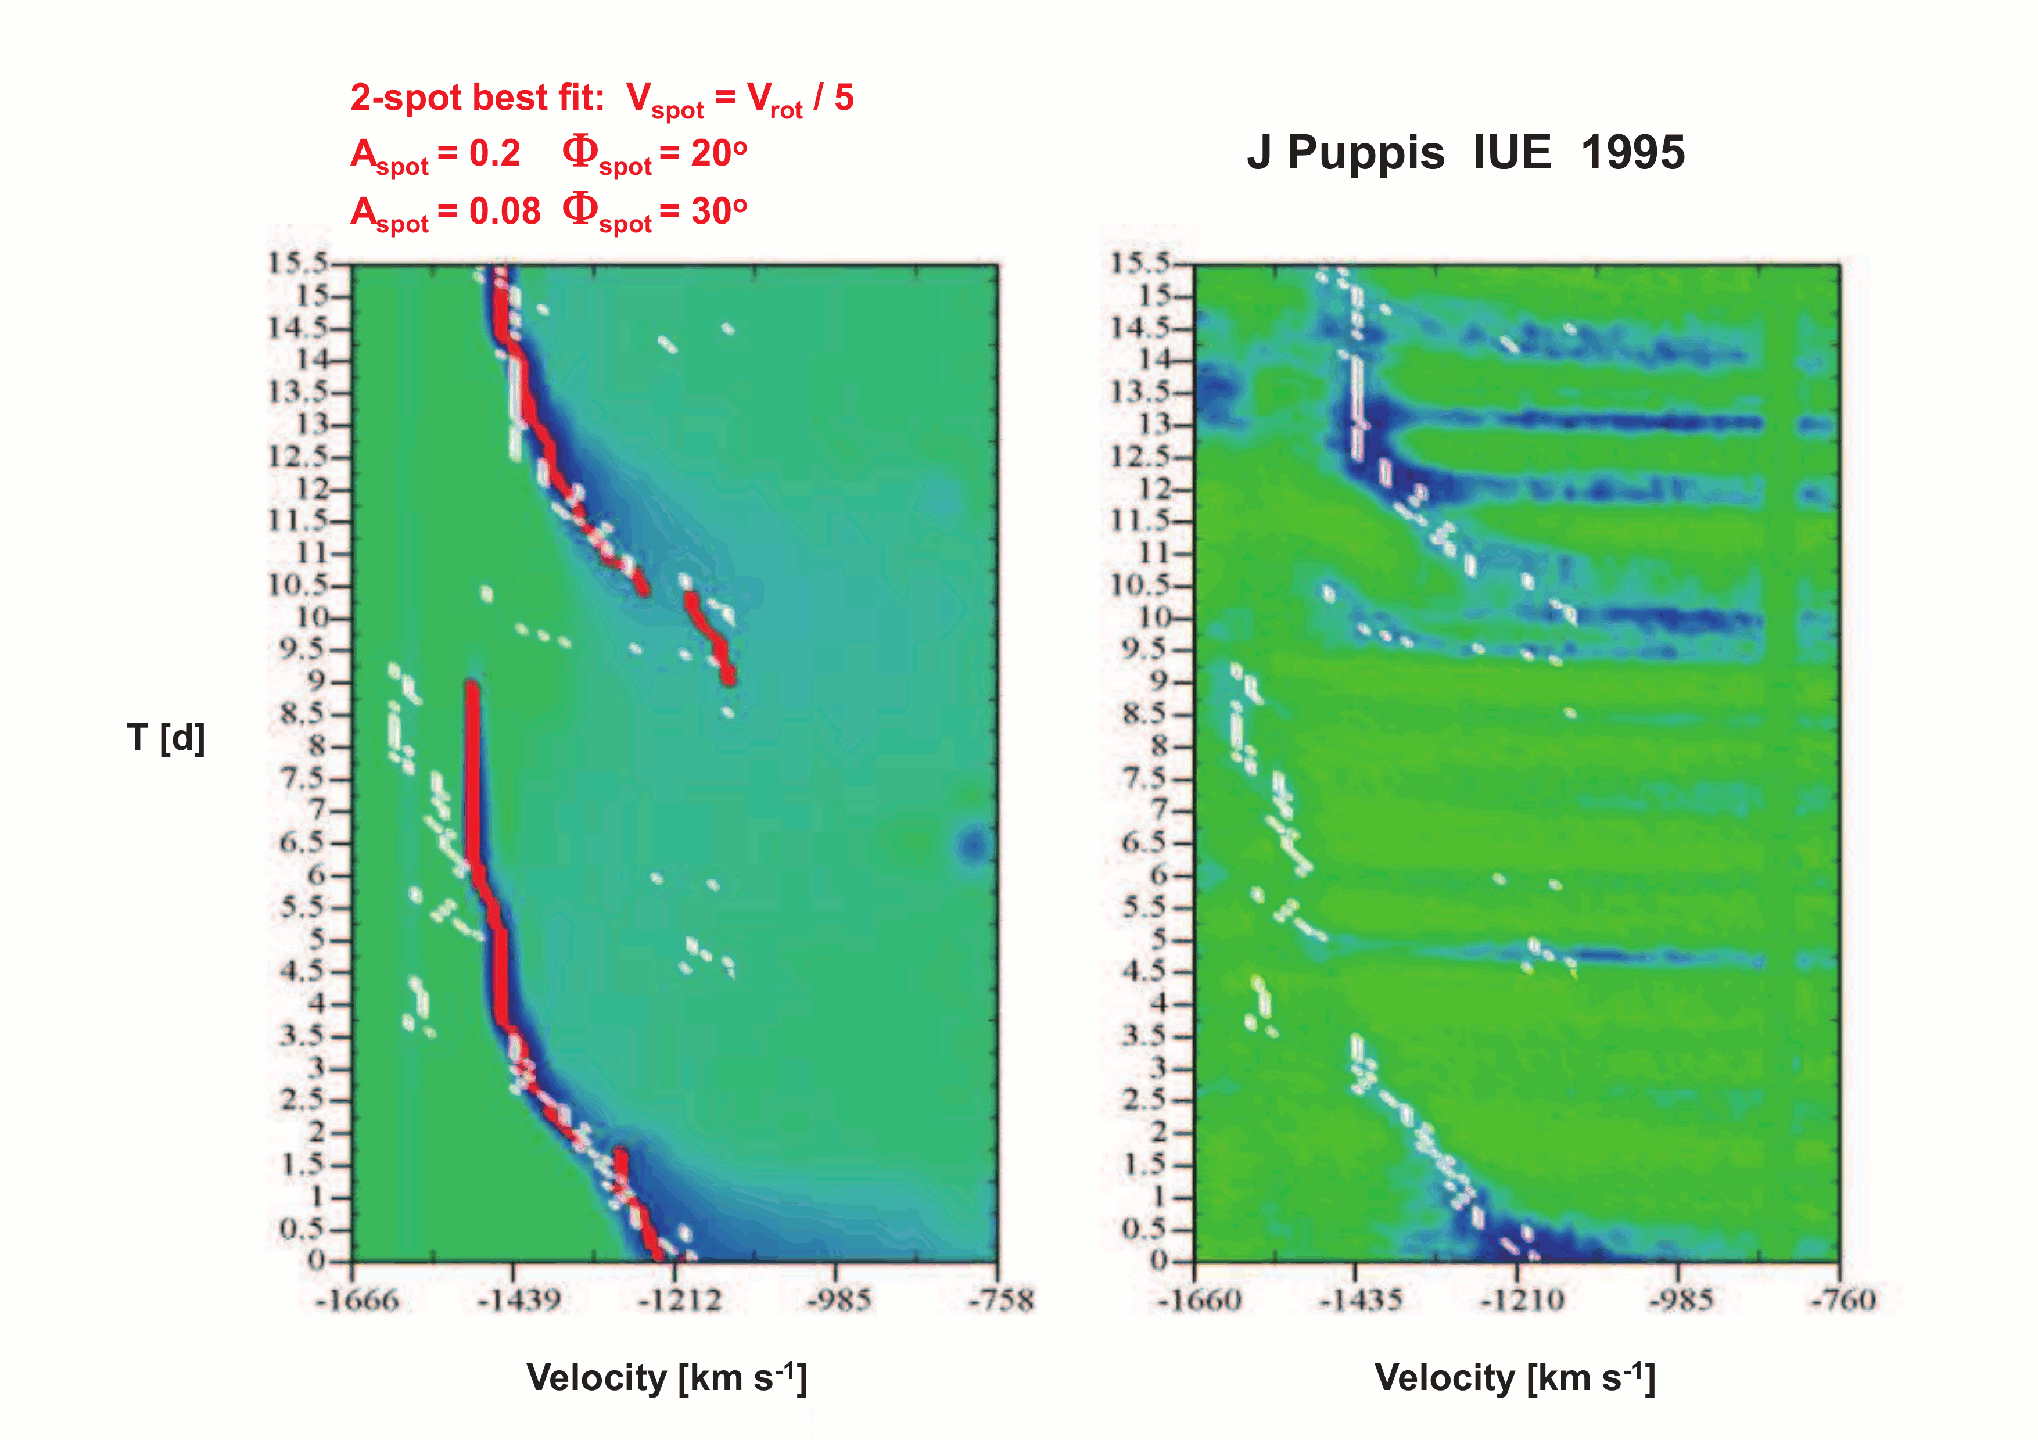
fig3:
Best-fit dynamic spectrum of Si iv λ1395 for the two-spot model (left-hand panel) compared to the observed spectrum (right-hand panel) of J Puppis. The shape and morphology of the computed DACs fit the properties of the observed DACs. Time T runs upwards. The velocity positions of the DAC flux minima differ by less than ∼20 km/s from the observed velocity positions (white dots). The FWHM of the computed DAC decreases from about 100 km/s at T=0 days to ∼20 km s/s around T=3.5 days, in agreement with the narrowing of the observed DAC. The lower DAC width remains almost constant over the following 6.5 days, after which it fades away.
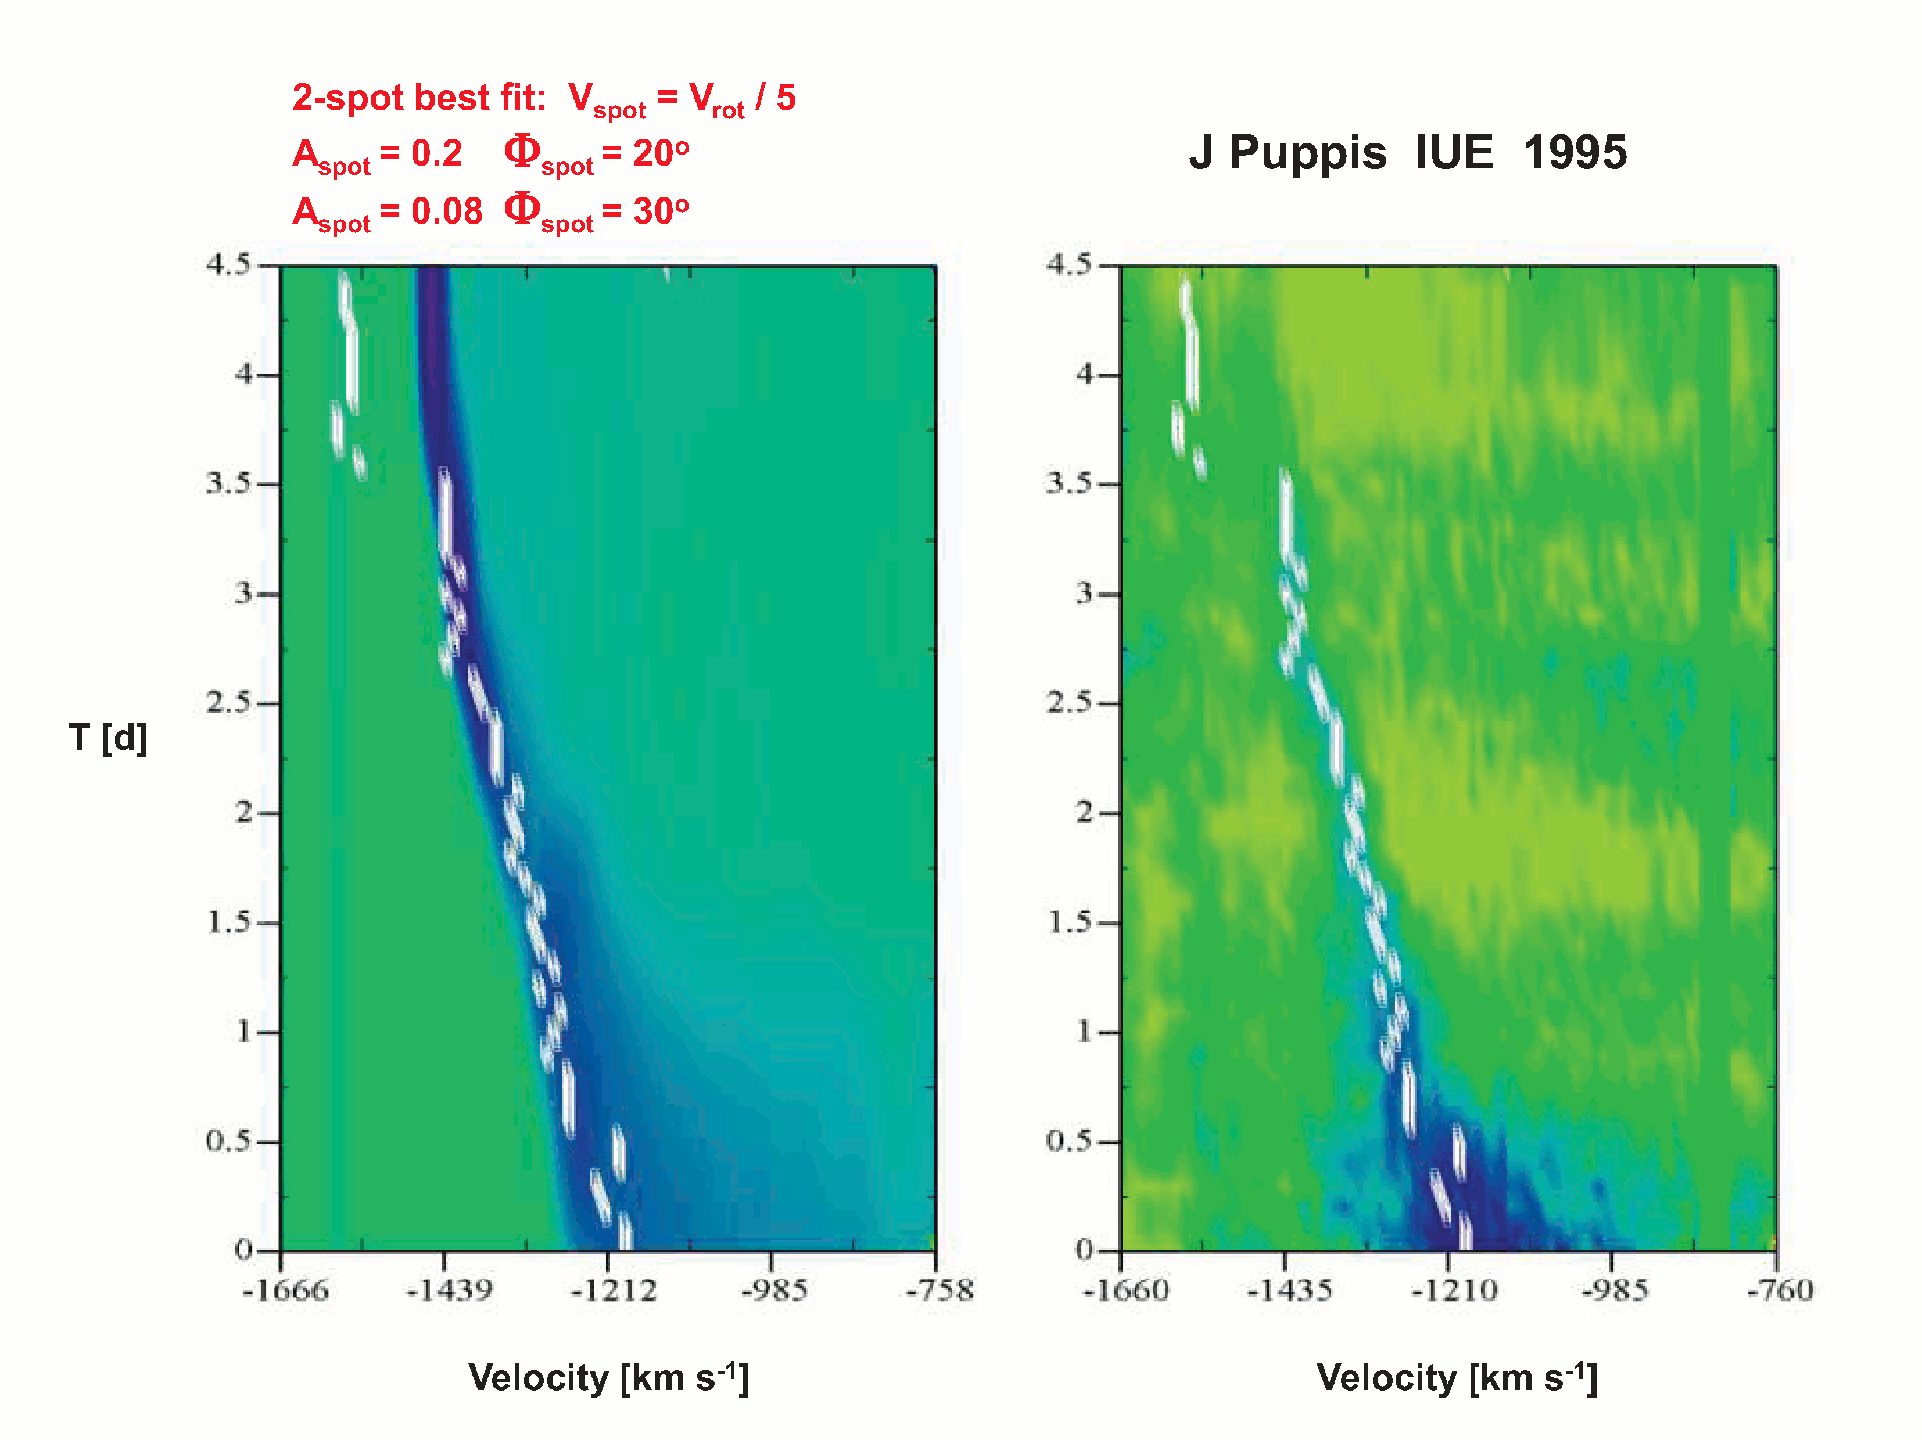
fig4:
Detailed comparison of the shape and morphology of a DAC computed using the best-fit two-spot model (left-hand panel), with Si IV IUE observations (right-hand panel) shown between -760 and -1600 km/s. The slanted triangle of the DAC base emerges from wind regions within a few stellar radii above the stellar surface. The DAC line formation region rotates in front of the stellar disk and samples decreasing dispersion of wind velocities projected in the line-of-sight, yielding the narrowing of the DAC base over time. The decrease of the computed DAC width is strongly dependent of the surface spot parameters since they uniquely determine the large-scale density and velocity structures the CIRs produce in the smooth ambient wind.
Links with more info and publication references:
Royal Observatory of Belgium Press Release Dec 08: Hottest Stars in Delicate Embrace by Spiral Arms
http://alobel.freeshell.org/wind3d.html
http://alobel.freeshell.org/hotstars.html
Modelling the Asymmetric Wind Structure in Luminous Blue Variable Binary MWC 314 (V1429 Aql)
We present a spectroscopic analysis of LBV binary MWC 314. The detailed spectroscopic variability is investigated to determine if MWC 314 is a massive binary system with a supersonically accelerating wind or a low-mass B[e] star. We compare the spectrum and spectral energy distribution to other LBVs (such as P Cyg) and find very similar physical wind properties, indicating strong kinship. We combined long-term high-resolution optical spectroscopic monitoring and V-band photometric observations to determine the orbital elements and stellar parameters and to investigate the spectral variability with the orbital phases.
We developed an advanced model of the large-scale wind-velocity and wind-density structure in MWC 314 using 3-D radiative transfer calculations with Wind3D that fit the orbitally modulated P Cyg profile of He I 5876. The He I line reveals wind outflow velocities above 1000 km/s. We find that MWC 314 is a massive semi-detached binary system of ~1.22 AU, observed at an inclination angle of i=72.8 degrees having an orbital period of 60.8 d and orbital eccentricity e of 0.23. The primary star is a low-vsini LBV with a stellar mass of 39.6 Msun and photospheric radius of 86.8 Rsun. The detailed radiative transfer fits with Wind3D show that the geometry of wind density is asymmetric around the primary star with an increased wind density by a factor of 3.3 leading the orbit of the primary. The variable orientation causes the orbital modulation we observe in the absorption portion of strong P Cyg wind lines. Wind accretion in the system produces a circumbinary disc. MWC 314 is in a crucial evolutionary phase of close binary systems when the massive primary star has its H envelope being stripped and is losing mass to a circumbinary disc. MWC 314 is a key system for studying the evolutionary consequences of these effects.
 fig5:
fig5:
3-D model of the wind geometry in the massive LBV binary MWC 314. The size of the vectors mark the velocity of the asymmetric wind from the primary due to orbital motion. The open right-hand arrow marks the observer line of sight. At longer distances the radiatively driven wind becomes symmetric around the binary center of gravity.
We model the radial velocity curve combined with the slow V-brightness variability observed in MWC 314. The latter V variability is caused by the deformation from the spherical shape of the primary's surface in a semi-detached binary system. The primary fills its Roche lobe and alters the projected surface area (against the sky) during the orbit. Figure 6 shows the increase in projected surface area at orbital phase of 0.8 around maximum V brightness (bottom left-hand panel). The surface deformation due to strong tidal interaction decreases at orbital phase 0.3 (top right-hand panel) because the distance between the stars further increases towards apastron around orbital phase of 0.6.
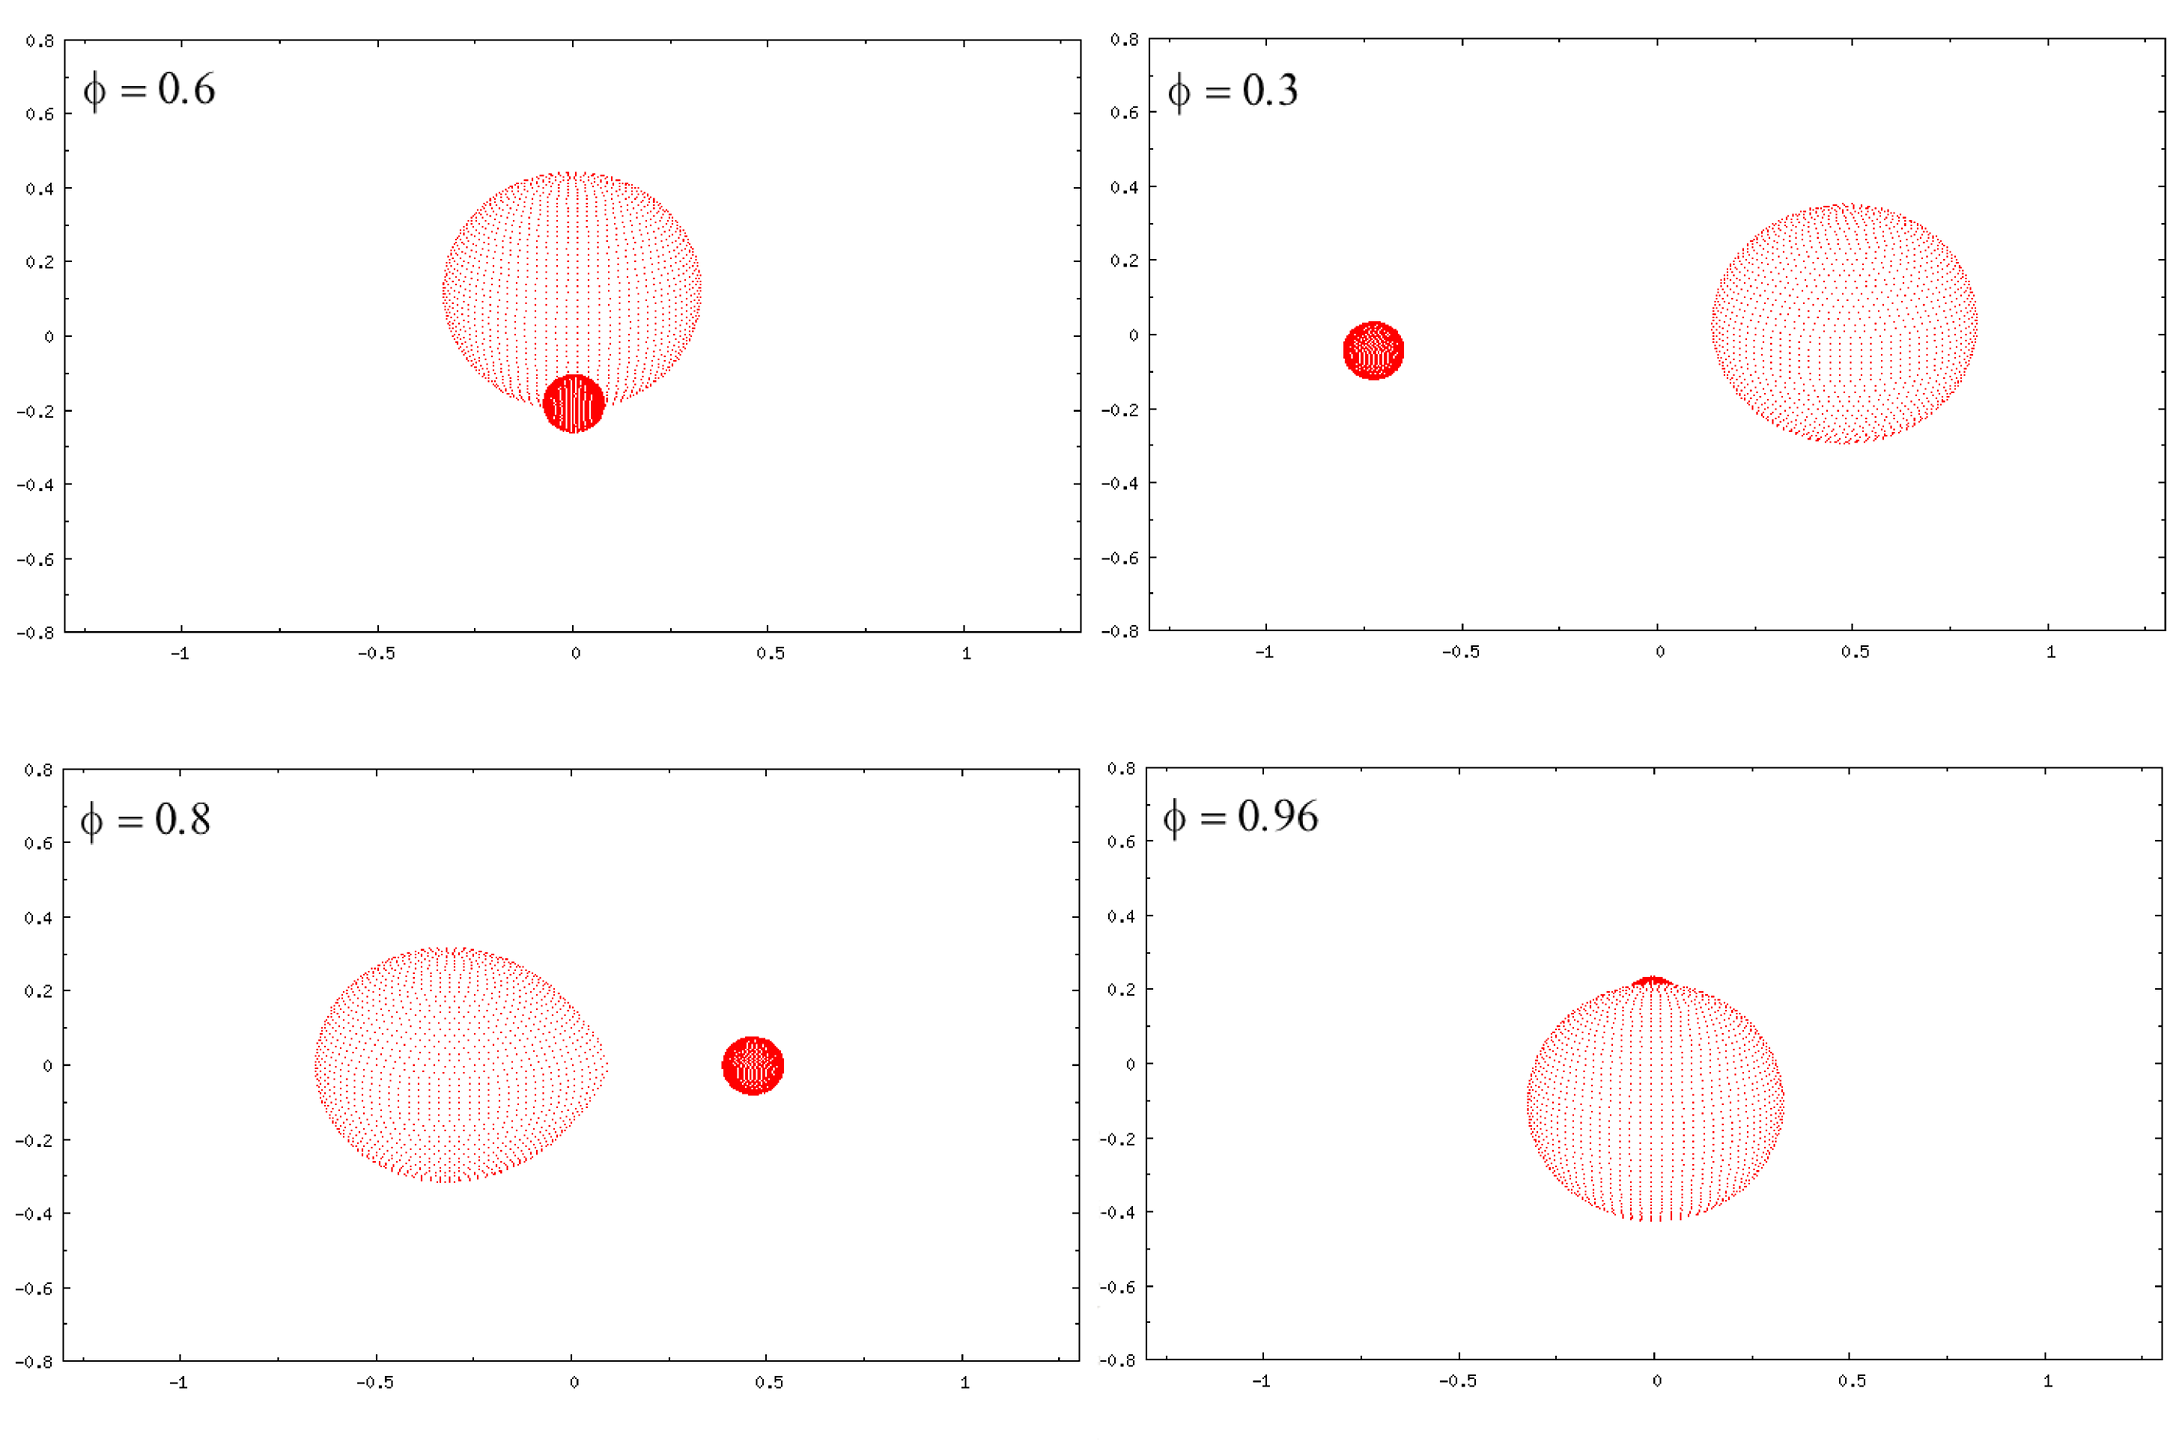
fig6:
Schematic representation of four orbital phases in the massive LBV binary MWC 314.
Strong He I 4471, 5876, 6678 emission lines show remarkable variability in the spectrum of MWC 314. The normalized line fluxes and dynamic spectra are shown with orbital phase in the heliocentric radial velocity scale in Fig. 7. The He I lines are single-peaked with emission flux maxima around the systemic velocity. The high-resolution spectra reveal variable blue-shifted absorption which becomes strongest during orbital phases between 0.65 and 0.85. The variable blue-shifted P Cyg absorption results from the increase in line-of-sight wind opacity in front of the LBV star during orbital phases of fastest approach to the observer between orbital phases 0.65-0.85. The orbitally modulated absorption observed in the He I lines signals an asymmetrically extended wind envelope with enhanced density oriented towards the wind region leading the orbit of the primary.
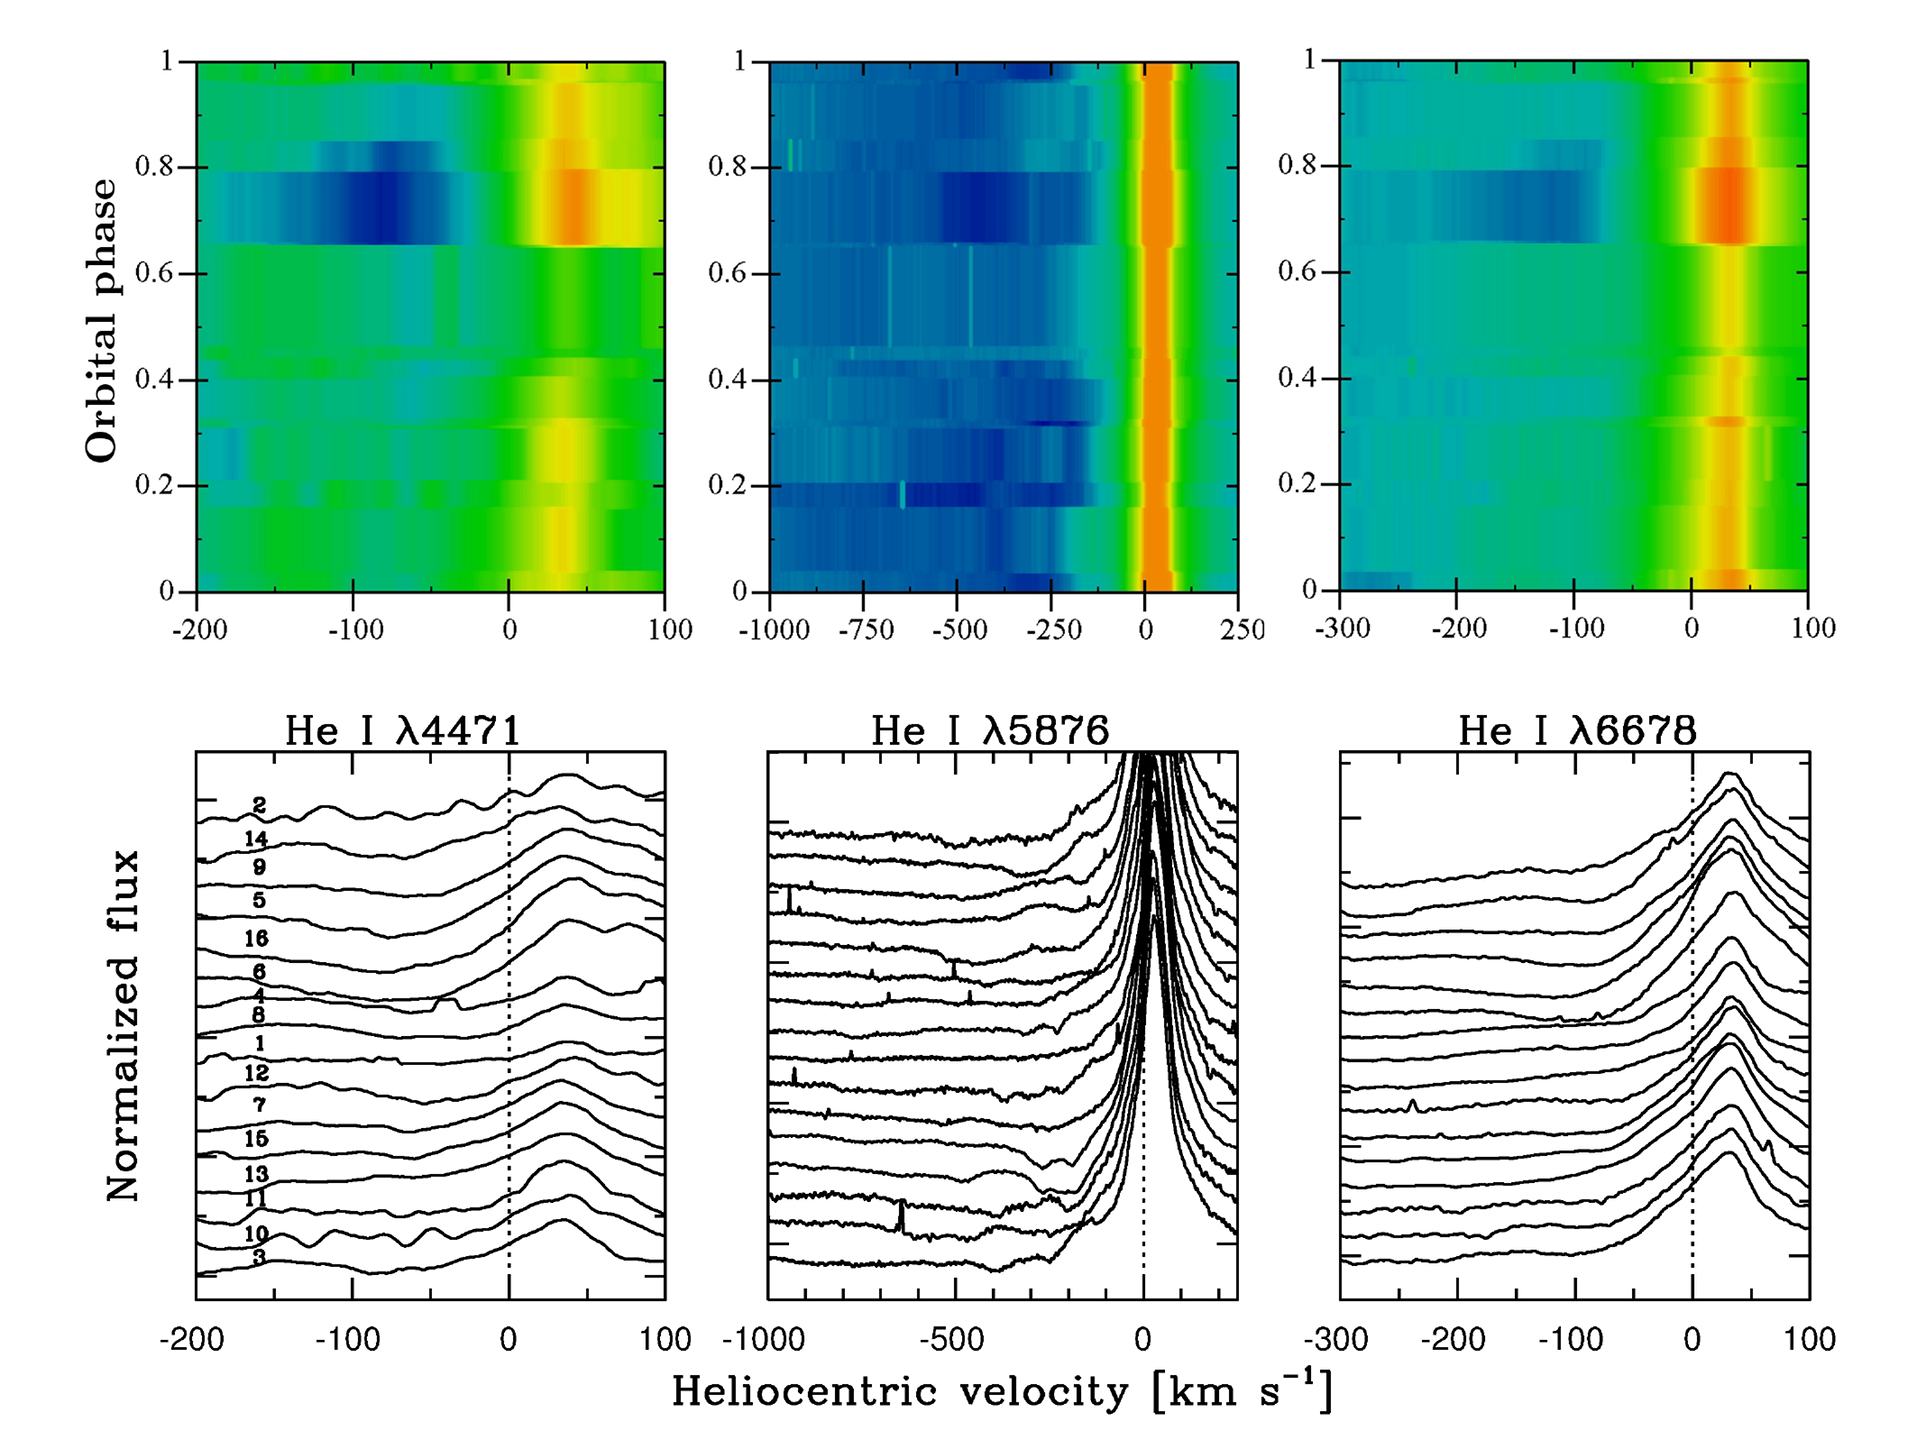 fig7 :
Three strong He I lines reveal remarkable variability of shape with orbital phase. They show single-peaked emission around the systemic velocity of MWC 314. The blue-shifted and variable absorption is strongest between the orbital phases of 0.65 to 0.85. The He I lines show variable P Cyg-type line profiles. This peculiar P Cyg line shape is always observed in He I 5876 of MWC 314.
Detailed 3-D radiative transfer modelling with Wind3D of He I P Cyg line profiles with orbital phases reveals that the geometry of wind density around the primary is asymmetric. It causes orbitally modulated variability of P Cyg absorption that forms in the primary's extended wind. The 3-D RT modelling requires a density enhancement factor of 3.3 above the smooth wind density. The asymmetric increase of wind density leads the orbital path of the primary.
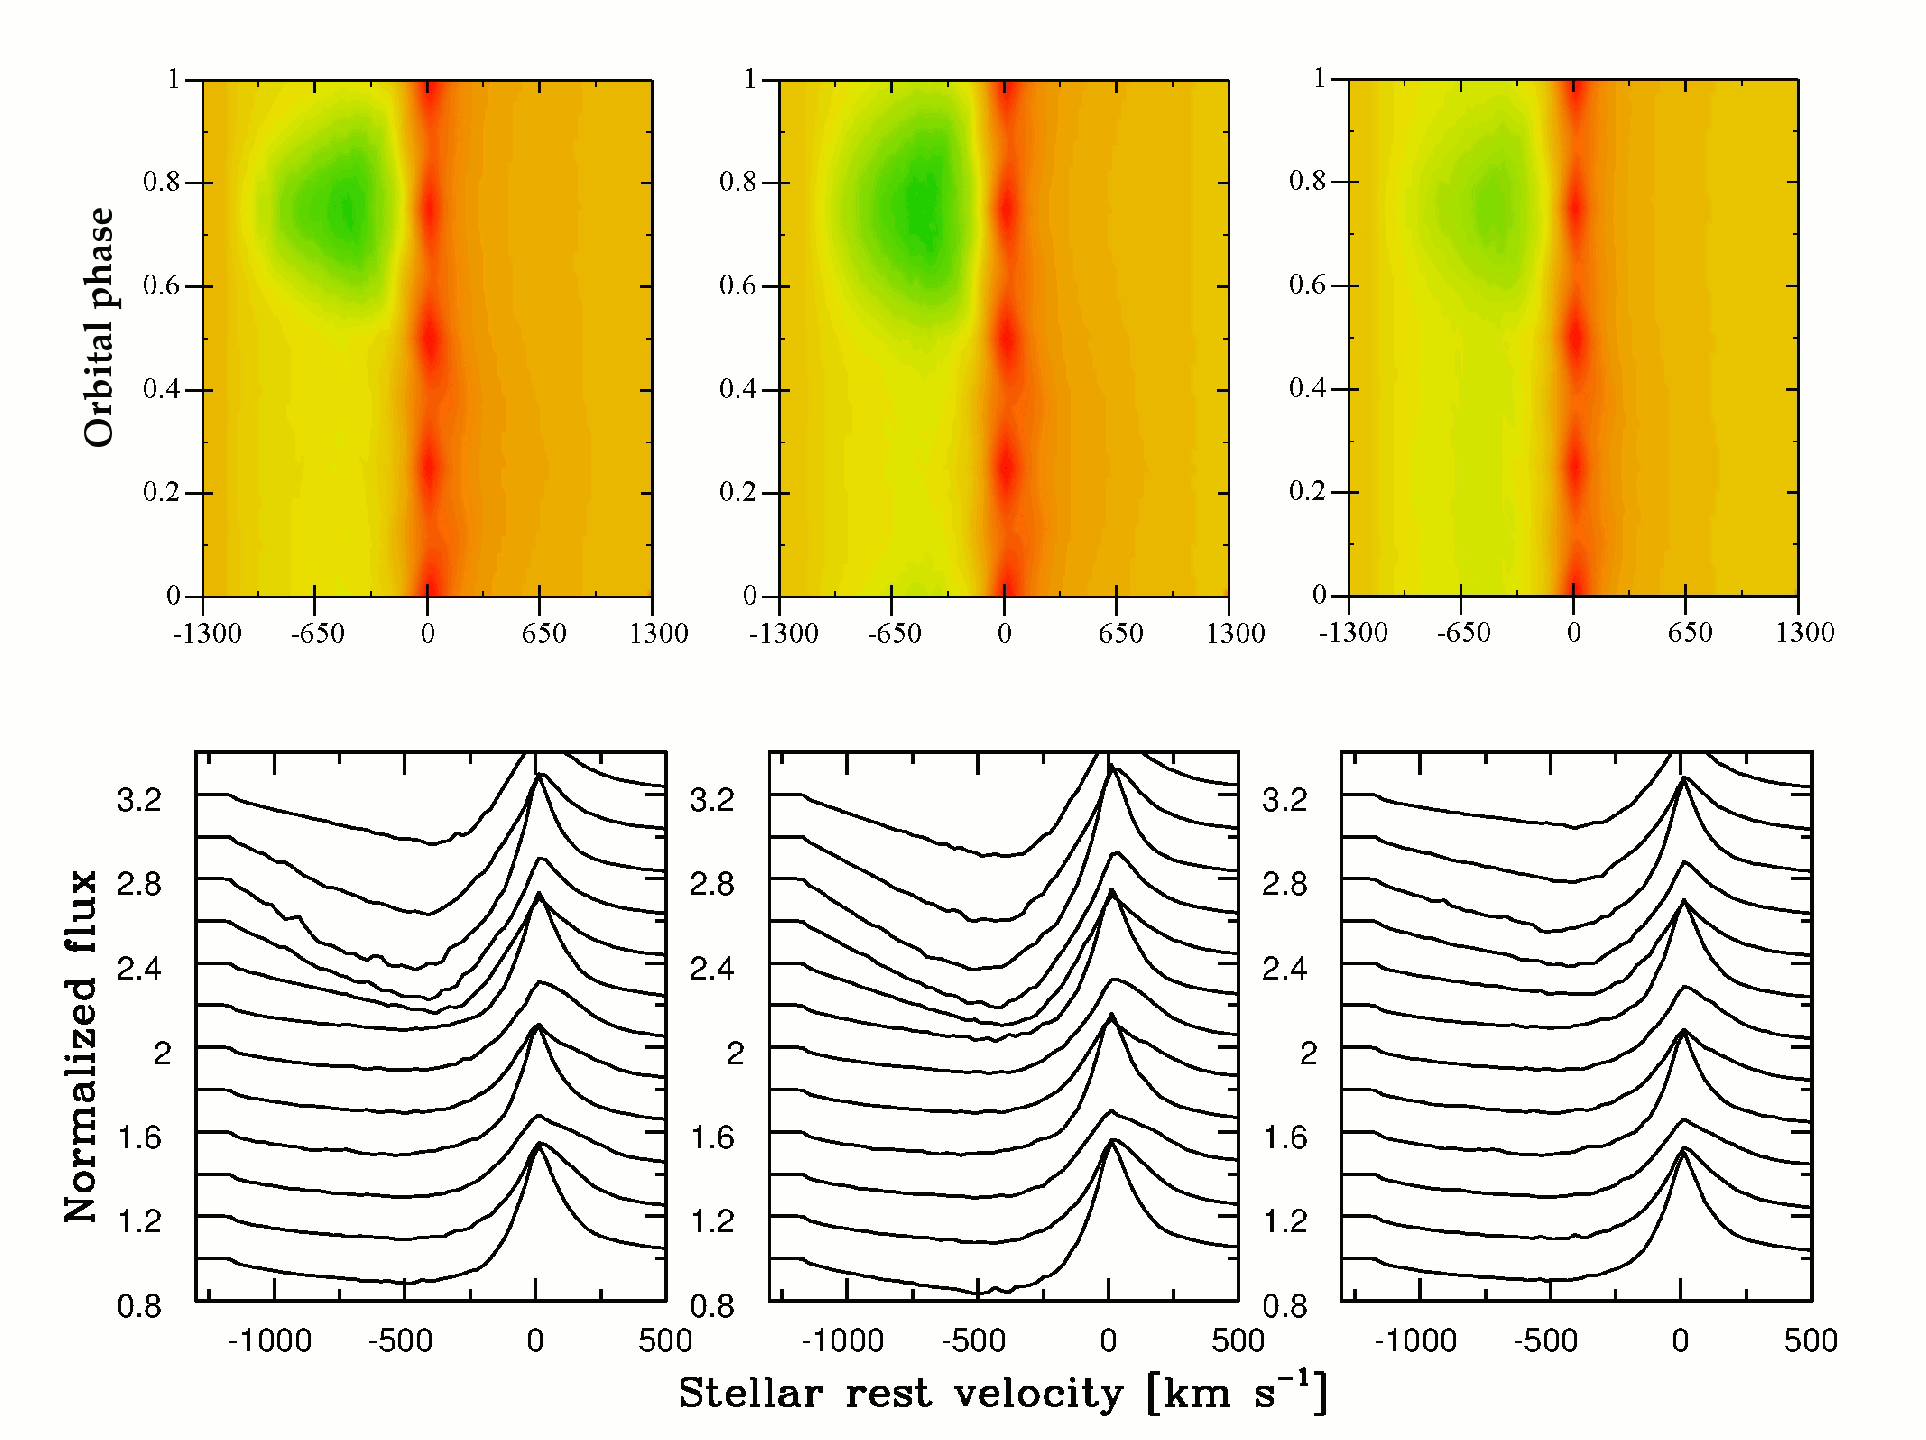 fig8 :
The top panels show dynamic spectra with orbital phase of He I 5876 computed with Wind3D using the 3-D asymmetric wind model in Fig. 5. The bottom panels show the corresponding normalized flux spectra calculated in 12 orbital phases. The 3-D wind model parameters used for the right-hand panel provide the best fit to the observed He I 5876 P Cyg absorption line profile changes shown with orbital phase in Fig. 9.
We perform a detailed comparison of observed and theoretical He I 5876 line profiles in MWC 314. The solid drawn lines in Fig. 9 show high-resolution spectra observed at orbital phase 0.444 (thin drawn black line) and at 0.795 (thick drawn black line). The theoretical spectra are overplotted with red dashed lines. At orbital phase 0.795 the He I absorption increases by ~15 % due to the increase of wind density in our line of sight by a factor of 3.3 for distances below two stellar radii in the wind of the primary. It causes a variable He I 5876 line opacity in wind regions of with outflow velocity below 600 km/s due to the orbitally modulated orientation of enhanced wind density in front of the LBV star.
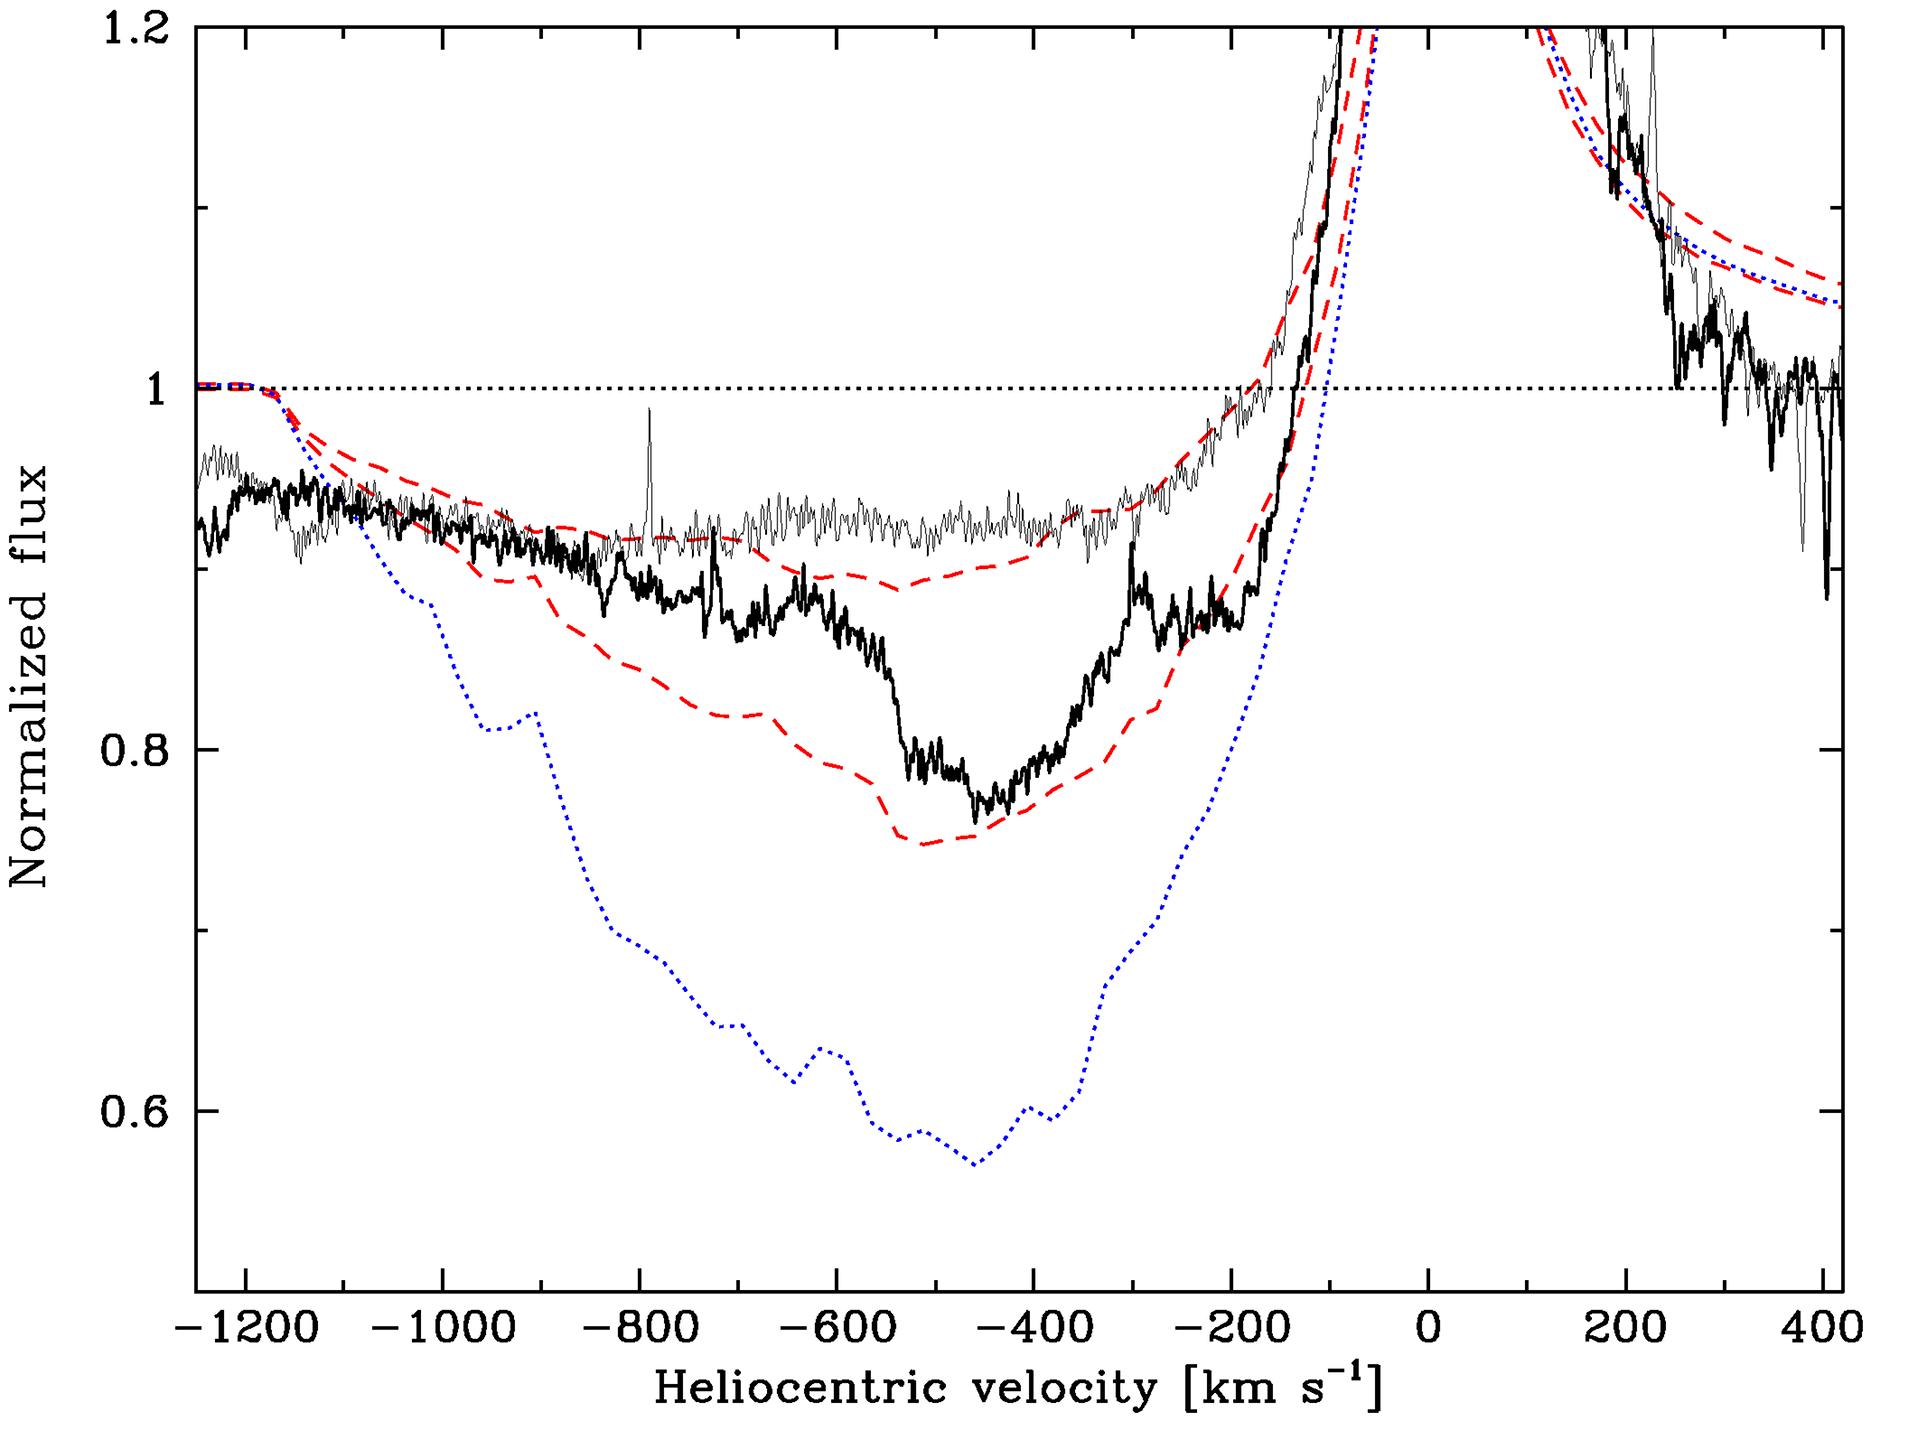 fig 9:
Detailed 3-D radiative transfer modelling of the orbitally modulated He I 5876 line observed in MWC 314 at orbital phase 0.444 (thin drawn black line) and at orbital phase 0.795 (boldly drawn solid line). The best fit to the P Cyg absorption at both orbital phases (dashed red lines) requires an asymmetric distribution of wind density around the primary star with a density enhancement factor f equal to 3.3. The absorption line computed for the model with f=10 is too strong at orbital phase 0.795 (dotted drawn blue line).
Publication references:
Lobel, A., Groh, J. H., Martayan, C., et al. 2013, A&A 559, A16
Lobel, A., et al. 2014, in IAU 307: New Windows on massive stars: asteroseismology, interferometry and spectropolarimetry, Univ. Geneva, Switzerland;